You have a Shopify store, a product people actually want, and $1,000 to spend on advertising. The question that stops most ecommerce brands in their tracks: Facebook Ads or Google Ads?
The honest answer is that it depends on your product, your audience, and your business stage. But "it depends" is not a strategy. This guide gives you a concrete framework for making that decision, along with the data, benchmarks, and budget scenarios you need to allocate your first advertising dollars with confidence.
We manage both Google Ads and Facebook Ads for ecommerce brands, so the comparisons here come from real campaign data, not platform marketing materials.
The Short Answer: It Depends on Your Product and Stage
Before we get into the details, here is the decision in its simplest form:
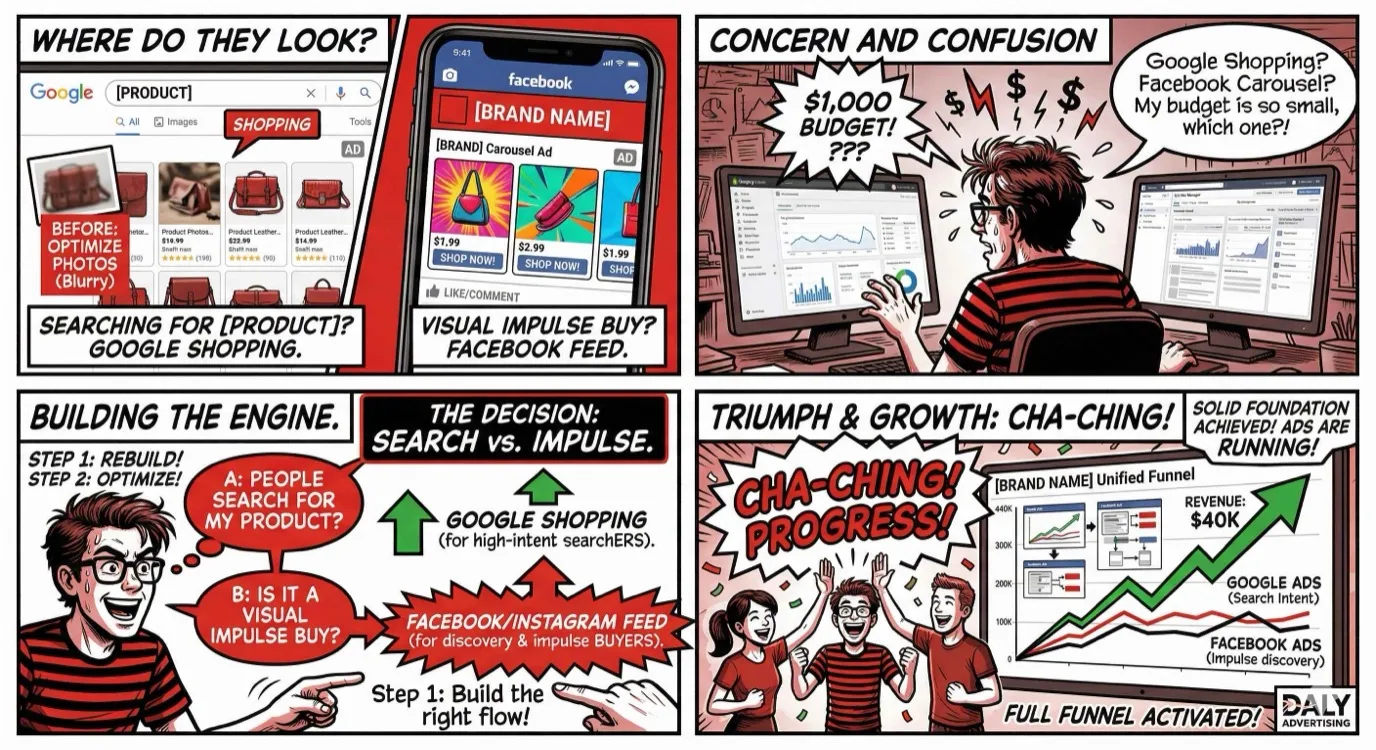
- If people search for your product on Google, start with Google Ads. You are capturing demand that already exists.
- If people do not know your product exists, start with Facebook Ads. You are creating demand through visual storytelling and audience targeting.
- If your product is visual, impulse-friendly, or lifestyle-driven, start with Facebook Ads. The creative formats are built for products like yours.
- If your product is functional, comparison-driven, or solves a specific problem, start with Google Ads. The buyer is already in research or purchase mode.
Now let us break down exactly how each platform works for ecommerce, what you should expect in terms of performance, and how to decide which gets your first $1,000.
How Google Ads Works for Ecommerce
Google Ads for ecommerce is fundamentally about capturing existing demand. When someone types "buy wireless headphones" or "best running shoes for flat feet," they have intent. They know what they want. Your job is to be visible at that moment with the right product and a compelling reason to buy from you.
Google Shopping: Visual Product Ads
Google Shopping ads are the backbone of ecommerce advertising on Google. These are the product image ads that appear at the top of search results with a photo, title, price, store name, and review rating. They are the most visually prominent ad format on Google and generate the majority of ecommerce ad clicks.
Shopping ads pull directly from your product feed (synced through Google Merchant Center). The quality of your product titles, descriptions, images, and pricing in Merchant Center directly impacts your Shopping ad performance. A well-optimized product feed can reduce cost per click by 20% to 30% compared to a poorly structured one.
Key optimizations for Google Shopping:
- Product titles: Include the brand, product type, key attributes (color, size, material), and target keywords. "Nike Air Max 90 Men's Running Shoes, Black/White, Size 10" outperforms "Air Max Shoes"
- Product images: Clean, white-background images perform best in Shopping. Lifestyle images can be tested but standard product photos are the baseline
- Competitive pricing: Google shows your price next to competitors. If you are 30% more expensive with no visible differentiator, you will get clicks but not conversions
- Reviews: Products with seller and product ratings get higher click-through rates. Integrate your review platform with Google Merchant Center to display star ratings
Search Ads: High-Intent Keywords
Standard search ads (text-based) complement Shopping ads by capturing searches that Shopping does not cover well, such as informational queries, competitor brand searches, and long-tail keywords. For ecommerce, search ads work best for:
- Brand defense: bidding on your own brand name to prevent competitors from stealing clicks
- Competitor targeting: bidding on competitor brand names to capture comparison shoppers
- Problem-based searches: "best gift for runners" or "how to fix dry skin" where the searcher has not identified a specific product yet
Performance Max: AI-Driven Campaigns
Performance Max (PMax) campaigns use Google's AI to distribute your ads across all Google properties: Search, Shopping, Display, YouTube, Gmail, and Discover. You provide creative assets (images, videos, headlines, descriptions) and a product feed, and Google's algorithm decides where and when to show your ads.
PMax is increasingly effective for ecommerce in 2026, especially for stores with a wide product catalog. The algorithm optimizes for conversions across channels, often finding combinations that a human campaign manager would not test. The trade-off is control: you have less visibility into where your budget is being spent and limited ability to adjust targeting by channel.
For stores spending under $3,000 per month on Google, PMax is often the best single campaign type because it covers all Google surfaces without requiring the complexity of managing Shopping, Search, Display, and YouTube campaigns separately.
Best For: Products People Actively Search For
Google Ads performs best for ecommerce products that have established search demand. If 5,000 people per month search for "stainless steel water bottle" and you sell stainless steel water bottles, Google is your platform. You are not convincing anyone to buy a water bottle. You are convincing them to buy yours.
Product categories that historically perform well on Google Ads include: electronics and accessories, home goods and furniture, health and beauty products with specific search terms, specialty foods and beverages, replacement parts and supplies, and any product where the buyer knows what they want before searching.
Typical ROAS Benchmarks for Google Ads
Return on ad spend (ROAS) varies significantly by product category, average order value, and competition level. Here are the benchmarks we see across ecommerce PPC campaigns:
| Campaign Type | Average ROAS | Strong ROAS | Notes |
|---|---|---|---|
| Google Shopping | 3x - 5x | 6x - 10x | Highest intent, best for product searches |
| Brand Search | 8x - 15x | 15x+ | Lowest cost, captures existing brand interest |
| Non-Brand Search | 2x - 4x | 5x - 8x | More expensive but reaches new customers |
| Performance Max | 3x - 6x | 7x - 12x | Varies widely, depends on creative quality |
A healthy overall Google Ads ROAS for ecommerce is 4x to 6x, meaning every $1 in ad spend generates $4 to $6 in revenue. Profitability depends on your margins, but most ecommerce brands need at least 3x ROAS to break even after accounting for product cost, shipping, and overhead.
How Facebook/Meta Ads Works for Ecommerce
Facebook (Meta) Ads for ecommerce is about creating demand. Instead of waiting for someone to search for your product, you put your product in front of people who are likely to want it based on their demographics, interests, behaviors, and resemblance to your existing customers.
Prospecting: Reaching Cold Audiences
Prospecting campaigns target people who have never heard of your brand. This is the top of the funnel and typically the largest portion of your Facebook ad budget. The goal is not immediate purchase (though that happens). It is to introduce your product to people who match your ideal customer profile and drive them to your store.
Effective prospecting audiences for ecommerce include:
- Interest-based audiences: People interested in topics related to your product. A sustainable clothing brand might target people interested in ethical fashion, zero waste, and environmental activism
- Lookalike audiences: Audiences modeled on your existing customers. Facebook analyzes the traits of your buyers and finds new people with similar characteristics. Start with a 1% lookalike (most similar) and expand to 2% to 5% as you scale
- Broad targeting: In 2026, Facebook's algorithm is often more effective with broad targeting (age, gender, and location only) than with narrow interest-based targeting, especially for stores with over 100 purchases per month. The algorithm finds your buyers faster when you give it room to explore
Retargeting: Cart Abandoners, Page Visitors
Retargeting campaigns show ads to people who have already visited your store but did not buy. These audiences are warm. They know your brand and your product. They just need a nudge to come back and complete the purchase.
Key retargeting audiences:
- Add-to-cart but did not purchase (last 7 to 14 days): Highest intent. These people were one click away from buying. Show them the specific product they added with urgency messaging or a small incentive
- Product page visitors (last 14 to 30 days): Interested but not committed. Show them social proof (reviews, UGC) and value messaging
- Website visitors (last 30 to 60 days): General awareness. Show them your best-selling products and brand messaging
- Email subscribers who have not purchased: Sync your email list to Facebook and run targeted ads alongside your email sequences
Retargeting typically delivers the highest ROAS of any Facebook campaign type (6x to 15x) because you are targeting the warmest audience. However, the audience size is limited by your website traffic, so it cannot scale indefinitely.
Lookalike Audiences: Scaling What Works
Lookalike audiences are Facebook's most powerful targeting tool for ecommerce scaling. Once you have enough customer data (ideally 500+ purchases), you can create lookalike audiences that tell Facebook: "Find me more people who look like my buyers."
The seed audience matters. A lookalike based on your top 25% of customers by lifetime value (LTV) will outperform a lookalike based on all website visitors. A lookalike based on repeat purchasers will find people more likely to buy multiple times. Use the highest-quality seed data you have.
Creative Formats: Carousel, Video, Collection, UGC
Creative is the most important variable in Facebook ad performance. The best targeting in the world cannot overcome a mediocre ad. Here is how each format performs for ecommerce:
Carousel ads let you showcase multiple products or multiple angles of a single product. Each card in the carousel can link to a different product page. Carousels work exceptionally well for collections, product lines, and "shop the look" concepts. Average performance: 20% to 30% lower cost per acquisition than single-image ads.
Video ads are the highest-performing format for prospecting campaigns. A 15 to 30-second video showing the product in use, the unboxing experience, or the before-and-after result captures attention in a way static images cannot. Hook the viewer in the first 3 seconds. No slow intros. Start with the product or the result immediately.
Collection ads display a hero image or video with a grid of product images below it. When tapped on mobile, they open an instant experience (full-screen product browsing) within Facebook. This format keeps the shopper inside the Facebook app longer and often improves conversion rates by 20% to 40% compared to sending traffic directly to your website.
User-generated content (UGC) is the single most effective creative type for ecommerce Facebook ads in 2026. Real customers talking about your product on camera outperforms professional production by 2x to 4x in our testing. UGC feels authentic in a feed full of polished content. It reads as a recommendation from a friend, not an ad from a brand.
Best For: Impulse Buys, Visual Products, Brand Building
Facebook Ads excels for products that sell on visual appeal, emotional connection, or impulse. Categories that perform well include: fashion and apparel, jewelry and accessories, beauty and skincare, home decor, food and beverage (especially DTC brands), fitness products, pet products, and any product with a strong visual identity or "wow factor."
Facebook is also the best platform for building a brand. Unlike Google where the interaction is purely transactional (search, click, buy), Facebook allows you to tell your brand story, build a community, and create emotional connection over time. This brand equity pays dividends across all channels.
Typical ROAS Benchmarks for Facebook Ads
| Campaign Type | Average ROAS | Strong ROAS | Notes |
|---|---|---|---|
| Prospecting (cold) | 1.5x - 3x | 3x - 5x | Highest volume, lowest ROAS, drives new customers |
| Retargeting (warm) | 6x - 10x | 10x - 20x | Limited by audience size, highest efficiency |
| Lookalike audiences | 2x - 4x | 4x - 7x | Best for scaling, performance depends on seed quality |
| Blended (all campaigns) | 2.5x - 4x | 5x - 8x | Overall account ROAS, what you see in your dashboard |
A healthy blended Facebook ROAS for ecommerce is 3x to 5x. Note that prospecting campaigns will often show below breakeven ROAS in isolation, but they feed the retargeting funnel and generate new customers that email marketing, repeat purchases, and lifetime value make profitable.
Head-to-Head Comparison
| Factor | Google Ads | Facebook/Meta Ads |
|---|---|---|
| Intent Level | High (user is searching) | Low to medium (user is browsing) |
| Average CPM | $10 - $30 (Shopping/Search) | $8 - $25 (varies by audience) |
| Average CPC | $0.50 - $3.00 (Shopping) | $0.50 - $2.00 |
| Average ROAS | 4x - 6x | 2.5x - 4x (blended) |
| Creative Requirements | Product feed (Shopping), text (Search) | Images, video, copy, UGC (high volume) |
| Learning Curve | Medium to high | Medium |
| Best Product Types | Searched products, commodity, functional | Visual, impulse, lifestyle, novel |
| Scalability | Limited by search volume | Nearly unlimited (audience-based) |
| Brand Building | Minimal | Strong |
| Retargeting | Display and YouTube (limited) | Advanced, highly effective |
Decision Framework: Which Platform to Start With
Use this framework to make the decision. Answer these four questions:
1. Do People Search for Your Product on Google?
Use Google Keyword Planner or a tool like Ahrefs to check monthly search volume for your product category. If there are thousands of searches per month for terms related to your product (not your brand name, but the product category), Google has proven demand waiting for you.
If search volume is low or nonexistent, your product is either too new or too niche for Google to be your primary channel. Facebook is the better starting point because you can reach the right audience without waiting for them to search.
2. Is Your Product Visual and Impulse-Friendly?
Does your product photograph well? Would someone stop scrolling to look at it? Is it priced low enough for an impulse purchase (under $50 to $80 for a first-time buyer)? If yes, Facebook's visual ad formats are built for products like yours.
If your product is technical, requires research, or is a considered purchase (over $100), Google's high-intent search traffic will likely convert better because the buyer is already in evaluation mode.
3. Do You Have Strong Creative Assets?
Facebook requires a steady stream of creative: images, videos, UGC, copy variations. If you have 10 to 15 creative assets ready to test, you can launch on Facebook immediately. If all you have is product photos on a white background, Google Shopping is easier to start with because your product feed is your creative.
4. What Is Your Average Order Value?
Higher AOV products (over $100) tend to perform better on Google because the cost per click is justified by the order value. Lower AOV products (under $50) can struggle on Google if the CPC is high relative to the purchase value. Facebook's lower CPMs make it more efficient for lower-priced products where you need high volume to be profitable.
The Decision Matrix
| Scenario | Start With | Reasoning |
|---|---|---|
| High search volume + functional product | Capture existing demand at high intent | |
| Visual product + strong creative | Create demand through visual storytelling | |
| New/unknown product category | Build awareness before demand exists | |
| High AOV + considered purchase | High intent justifies higher CPC | |
| Low AOV + impulse purchase | Lower CPM, higher volume at scale | |
| Strong brand story + lifestyle appeal | Brand building drives long-term value | |
| Commodity product + competitive pricing | Google Shopping | Price comparison drives purchase decision |
Budget Allocation Scenarios
$1,000/Month: Pick One Platform
At $1,000 per month, split your budget across both platforms and neither will have enough data to optimize effectively. Facebook needs roughly 50 conversions per week to exit the learning phase. Google Shopping needs consistent clicks to gather quality score and conversion data.
Pick the platform that best matches your product (use the decision framework above) and allocate the full $1,000 there. Spend the first 2 to 3 weeks testing and the remaining weeks scaling what works.
If you choose Facebook: allocate $800 to prospecting campaigns and $200 to retargeting. Test 3 to 5 ad creatives against 2 to 3 audience segments.
If you choose Google: allocate $700 to Shopping/PMax campaigns and $300 to brand search. Optimize your product feed before launching. Focus on your best-selling products.
$3,000/Month: Primary Platform + Retargeting on Secondary
At $3,000 per month, you can run a primary platform aggressively and use the secondary platform for retargeting. This is the sweet spot for ecommerce brands that are ready to scale beyond one channel.
If Facebook is primary:
- $2,000 on Facebook prospecting and retargeting
- $700 on Google Shopping (your top products only)
- $300 on Google brand search
If Google is primary:
- $1,800 on Google Shopping/PMax
- $400 on Google brand search
- $800 on Facebook retargeting (website visitors, cart abandoners, email list)
The retargeting on the secondary platform is critical. People who discover your product on Facebook may Google your brand name before buying. People who see your product on Google Shopping may not buy immediately but can be retargeted on Facebook. The two platforms complement each other even when one is dominant.
$5,000+/Month: Full-Funnel Both Platforms
At $5,000 or more per month, you have the budget to run a full-funnel strategy across both platforms. This is where ecommerce marketing gets really powerful.
- $2,500 on Facebook: $1,800 prospecting (cold audiences and lookalikes), $700 retargeting (site visitors, cart abandoners, engaged audiences)
- $2,000 on Google: $1,200 Shopping/PMax, $500 non-brand search, $300 brand search
- $500 reserved: For testing new creatives, audiences, or campaign types. This testing budget prevents the rest of your campaigns from being disrupted by experiments
At this budget level, consider using a tool like our Facebook Ads calculator to model different scenarios and find the optimal allocation based on your specific metrics.
Running Both Together: The Full-Funnel Approach
The most successful ecommerce advertising strategies use Facebook and Google together as a system, not as isolated channels. Here is how the full funnel works:
Facebook for Awareness and Prospecting
Facebook introduces your brand and product to cold audiences. Prospecting campaigns show your product to people who match your ideal customer profile but have never heard of you. The immediate ROAS on these campaigns might be 1.5x to 2.5x, which looks unprofitable in isolation.
But these campaigns are doing something Google cannot do: creating demand. Every person who sees your Facebook ad and visits your store is now a potential Google searcher, an email subscriber, or a retargeting audience member.
Google for Capturing Intent Created by Facebook
After someone sees your Facebook ad, a percentage of them will go to Google and search for your brand name or your product category. Your Google brand search and Shopping campaigns capture that intent. Without Google Ads, a competitor bidding on your brand name intercepts the customer that your Facebook ad created.
This is why brand search campaigns are so important even though they feel like you are paying for traffic that should be "free." In reality, brand search protects the demand that your Facebook spend created. The cost is typically pennies per click, and the ROAS is 10x to 15x+.
Retargeting Across Both Platforms
Someone visits your store from a Google Shopping ad but does not buy. A Facebook retargeting ad shows them the exact product they viewed, along with a customer review. They come back and purchase. Which platform gets credit? Both contributed.
Run retargeting on both platforms because your audience is on both platforms. Some people spend more time on Facebook and Instagram. Others spend more time on Google properties. Retargeting on both ensures you reach them wherever they are.
The full-funnel approach typically produces 30% to 50% higher total ROAS than running either platform alone, because each platform amplifies the effectiveness of the other.
Attribution Challenges and How to Solve Them
Multi-platform ecommerce advertising creates an attribution headache. Facebook says it drove the sale. Google says it drove the sale. Your Shopify dashboard shows a different number than both of them. This is not a bug; it is the nature of multi-touch marketing.
Why the Numbers Never Match
Each platform uses its own attribution window and takes credit for any conversion it touched. Facebook defaults to a 7-day click and 1-day view attribution window. Google uses a 30-day click window. If a customer clicked a Facebook ad on Monday and a Google ad on Thursday before purchasing, both platforms claim the sale.
iOS privacy changes have made this worse. Facebook lost significant tracking capability with iOS 14.5+ opt-outs, which means it under-reports conversions by 15% to 30% in many cases. Google is less affected but still experiences data loss from browser privacy features and ad blockers.
How to Get Closer to Truth
No attribution model is perfect, but here are the approaches that give you the clearest picture:
- Use a third-party attribution tool: Platforms like Triple Whale, Northbeam, or Rockerbox provide a unified view across all channels with customizable attribution models. These tools cost $100 to $500+ per month but pay for themselves by enabling better budget decisions
- Track blended ROAS: Total revenue divided by total ad spend across all platforms. This avoids the double-counting problem entirely. If your blended ROAS is 4x and your break-even is 2.5x, your advertising is profitable regardless of which platform gets credit for which sale
- Monitor contribution margin: Revenue minus COGS, shipping, and ad spend. This is the number that actually matters for business health. Track it weekly
- Use incrementality testing: Periodically turn off a channel in a specific geographic region and measure the revenue impact. This shows you the true incremental value of each platform, not just what its attribution model claims
- Implement server-side tracking: As discussed in our ecommerce marketing guide, server-side tracking recovers 20% to 40% of the conversion data that browser-side tracking misses
Common Mistakes Ecommerce Brands Make with Paid Ads
1. Starting Both Platforms at the Same Time with a Small Budget
A $1,000 budget split 50/50 gives each platform $500. Neither platform has enough budget to exit the learning phase and optimize effectively. Pick one, learn it, profit from it, then expand. Spreading thin is the fastest way to burn budget and learn nothing.
2. Judging Facebook Prospecting by Direct ROAS
Prospecting campaigns target cold audiences. Their job is to introduce your brand, not to generate immediate sales at a 5x ROAS. If you shut down every prospecting campaign that does not hit your target ROAS immediately, you are cutting off the top of your funnel. Measure prospecting by cost per new customer acquired and evaluate profitability through lifetime value, not first-purchase ROAS.
3. Neglecting Creative Refresh on Facebook
Facebook ad creative fatigues. The same ad shown to the same audience over and over loses effectiveness. Performance typically starts declining after 2 to 4 weeks. Plan to introduce 3 to 5 new creative assets every 2 weeks. This does not require expensive production. New UGC, new copy angles, or new product combinations are all valid refreshes.
4. Not Optimizing the Product Feed for Google
Google Shopping performance is 80% product feed quality. If your product titles are vague, your images are poor, or your pricing data is inaccurate, no amount of bidding strategy will fix it. Spend time on your feed before scaling your budget.
5. Ignoring Post-Click Experience
Both platforms can deliver the click. What happens after the click is on you. A slow-loading product page, a confusing checkout process, or missing trust signals kill conversion rates. As we cover in our Shopify marketing strategy guide, fixing the post-click experience often delivers more ROI than increasing ad spend.
6. Setting and Forgetting
Paid advertising is not passive income. Both platforms require weekly optimization: pausing underperforming ads, testing new creatives, adjusting bids, refining audiences, and responding to performance changes. The brands that treat paid ads as an active, managed channel consistently outperform those that set campaigns up and check back in a month.
7. Not Having a Post-Purchase Strategy
Acquiring a customer through ads is expensive. The profit on the first purchase is often razor-thin or negative. The real money is in the second, third, and fourth purchase. Email marketing, loyalty programs, and subscription offers turn first-time ad-acquired customers into profitable repeat buyers. If you do not have a post-purchase strategy, your customer acquisition cost will always feel too high.
8. Comparing Platform Metrics Apples to Oranges
Facebook reports in CPM, link clicks, and outbound CTR. Google reports in impressions, clicks, and search impression share. The terminology and methodology are different enough that direct comparisons are misleading. Focus on universal metrics: cost per acquired customer, blended ROAS, and contribution margin. These are the numbers that tell you whether your advertising is working, regardless of platform.
Where to Spend Your First $1,000
If you have read this far, you have the framework to make the decision. Here it is one more time, as simply as possible:
- Determine whether your product has Google search demand (use Keyword Planner)
- Assess whether your product is visual and impulse-friendly
- Evaluate your creative assets
- Consider your average order value
If most signals point to Google, put your $1,000 there. If most point to Facebook, put your $1,000 there. If it is genuinely a coin flip, go with Facebook because the audience and creative data you collect will be valuable no matter what you do next.
The goal of your first $1,000 is not to get rich. It is to learn which audiences, creatives, and products respond to paid advertising so your next $1,000 performs better. Treat it as an investment in data, not an expense for revenue.
We manage both Google and Facebook ads for ecommerce brands, building full-funnel strategies that turn ad spend into profitable, scalable revenue. If you want a team that knows both platforms inside and out and can help you decide where your budget will work hardest, request a free audit and we will build a plan specific to your store.